Unhedge Signal: The Bear Just Got Frozen Back
- Vincent D.

- Nov 30, 2025
- 4 min read
We may be about to re-enter the market. Our Hedge signal has moved back into the safe zone on TradingView, but not yet on our DataHub. Unlike the discrepancies that sometimes occur with our Option Model, this difference is expected because the underlying data is not exactly the same. For those who were with us in May 2024, you may remember that when we first started working on our DataHub, we ran into an issue: the underlying data for our breadth-related signal was simply far too expensive for us to purchase.
We therefore decided to code our own script to track the exact same thing by calculating the metric directly on the ~4,500 existing stocks every 15 minutes. The resulting signal tracks the TradingView script almost perfectly, but it can occasionally lead or lag by a single day.
However, unlike the Option Model—which has a very nonlinear behaviour and can generate situations where one version triggers and the other doesn’t—this indicator is much more linear and I expect the datahub version to follow tomorrow. Considering that the TradingView version is reported only after the close, while our DataHub metric is calculated every 15 minutes, it means that the decision to fully re-enter the market was going to be for tomorrow (Monday) anyway. [Note: some of you may have noticed the signal appearing below the threshold on Friday during the trading session. For reasons that make sense in the context of short-timeframe day trading, TradingView will, by default, use the previous day’s value when the current day’s data is not yet available, and will keep replicating it throughout the day until the update arrives. So on Friday, before the close, what was actually moving that signal was Wednesday’s value. This is one of the limitations we wanted to avoid by building our Datahub, where this data is refreshed every 15 minutes in real time during market hours.]
I mentioned before that our market-breadth indicator was designed specifically to avoid flip-flopping during corrections and that it has a perfect record outside of bear markets over the last 20 years.

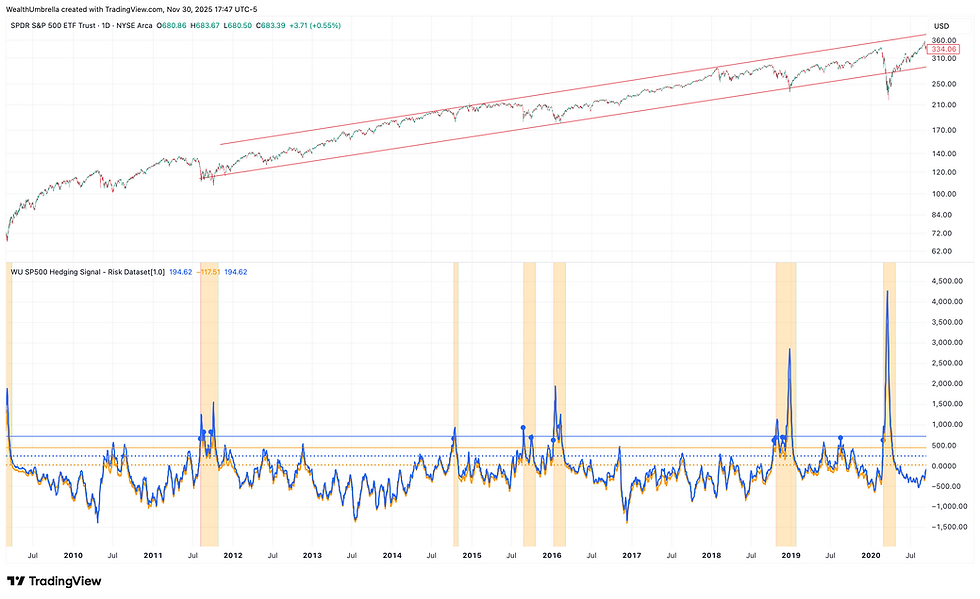
As you can see on this graph, no bounce has ever rallied enough stocks for this indicator to fall back under its bullish line before another leg of the correction followed. Below is an interesting close-up from the Tariff drawdown that illustrates how this indicator typically behaves during a bounce.

Here is the major correction of fall 2018 as another example.

There is an exception in 2015, where we essentially had a dual correction spread by 3 months. In both cases the indicator ignored the respective bounces but did re-enter the market in between. That is the worst outcome this signal has ever produced, but still it was probably the rihgt call in the context.

But as you know, 100% in the past does not guarantee 100% in the future. Everyone relying on Claudia Sahm’s recession indicator learned this lesson in September 2024 when the Sahm Rule triggered without a recession following despite the perfect historical track record. In our specific case, if we account for the number of instances where this indicator bounced above and below that line correctly (18 instances outside bear markets), the Wilson score tells us that the true success rate of this threshold should be expected somewhere between 82% and 100%. This is why I said in my last update that I have very strong confidence in this indicator.
I’m giving these stats, as I often do whenever we get an unhedge signal, to help you understand the historical odds so each of you can make decisions based on your own risk profile and tolerance.
Seeing this indicator drop back under its threshold did not surprise us. This is why, last week, we mentioned that selling our QQQ position carried very little downside. If the market had flipped back down, we would have remained neutral. But if the market was about to resume a new uptrend, a bullish signal from our Hedge Algorithm was only one or two candles away (and we would switch into a leveraged position).
Also, given that our DE2 indicator from the Downtrend Exhaustion dashboard had already turned orange at the recent bottom, historical patterns suggested that we were more likely seeing the true end of the correction rather than just the end of a first wave. Outside of major, highly volatile corrections like the one in April, an orange signal typically appears near the end of a correction.

More Bullish than Bearish
Alongside our market breadth related indicator that printed a bullish signal, we also started seeing on Friday some of the signs we were anticipating that would point toward a renewed uptrend. Our Option Model finally began to curve upward.

Our NYSE and Nasdaq derivative-volume signal also turned up after nearly a full month of steady decline.

We also recorded a strong impulse down from our Option Impulse signal, which is one of the internal components of the Hedge.

We are still only halfway to the unhedge threshold, but that threshold is incredibly conservative and does not always trigger even when our hedge kicks in—as you can see from how it behaved back in April.
SKEW also finally dropped, which isn’t surprising considering most of our option indicators now suggest that people are letting go of some of the protection they were buying.

To be honest, seeing SKEW in the mid-130s along with a deeper Option Impulse signal would have made me more confident in the bullish outcome, but there are still enough bullish signs for me to want to re-enter the market.
Our plan is to rebuild our position opportunistically. Our market-breadth signal suggests that the market should have better days ahead, but it is in no way an exact-timing signal. After five consecutive green days, we should get a retest soon. The most likely scenario is that we will move into QLD (2× Nasdaq) on one of the upcoming red candles.
We will keep you informed when we make the move, and if we decide to wait longer, we will update this post to explain what we are seeing.
Varia
We said we would be releasing our new WU AI analyst on December 1, which is tomorrow. The robot is already live on our platform, but we may need two more days of testing before making it public. We now expect it to go live on Wednesday and will notify you as soon as it’s released.


Hi WU team. Not to speak for everyone, but maybe others are wondering - is everything ok with the team and Vincent? Haven’t seen much in the way of posts to support even the multiple QLD posts, to say nothing of any general commentary on the broader market or the crypto space.
Is something amiss?
Any updates with these QLD buys?
Hi Vincent,
Thank you for the analysis! You mentioned that the market breadth indicator is calculated every 15 minutes. How feasible would it be for this chart to show more discrete data, e.g. hourly time frame, in addition to the daily time frame? Since it is one of the more important data during corrections, I tend to look at the hourly trend during the day, especially when data suggests correction may be losing momentum.
Thanks!
Based on the post I thought the datahub version of hedge signal should have turned to WU IN today. I saw it's still WU OUT all day today and after close. is this expected? Thanks.
Hi Vincent:
Thanks for the update. GREAT JOB
Is there a blog that describles all these indicators