top of page
=
BTC Umbrella Access
S&P 500 Umbrella Access
Bridging the Gap Between
Market Coverage and Stock Level Precision
Why We Created WU Advanced
Investing successfully involves understanding both the market’s overall trends and the specifics of individual stocks. While our S&P 500 Umbrella focuses on broad market defensiveness, WU Advanced was created to complement it—by adding tools for deeper market insights and stock-level data analysis. Through a suite of advanced dashboards, it helps you screen opportunities, validate stock quality, fine-tune strategies, and support every step of your investment process.

Who is WU Advanced For?
-
Investors who need more granular, stock‑focused analysis in addition to market‑wide data
-
Traders looking to test and refine technical strategies using structured analytics
-
Experienced users seeking a deeper understanding of stock behavior and market structure
A 3-Step Stock Strategy Builder +
Deeper Market Insights
Individual Stock Optimizer,
3 Organized Dashboards
1. Discovering
Retail Momentum Screener
Spot the Spark Before It Gains Traction
This dashboard highlights a curated list of stocks currently showing signs of rising retail interest. Based on custom-defined patterns and statistical filters, it flags setups where past data suggests the potential for strong momentum runs.
-
Surface stocks that retail investors are starting to focus on.
-
Save time with a curated, data-backed shortlist.
-
Act before momentum becomes consensus.

2. Evaluating
Stock Health Dashboard
Measure the strength behind the signal before committing
Validate stock quality in a click. The dashboard brings together the most relevant technical, fundamental, and sentiment data—so you can assess a stock’s strength quickly and clearly, without needing to dig through multiple sources.
Metrics include:
-
Technical Indicators
-
Valuation Metrics
-
Financial Strength
-
Earnings Momentum
-
Analyst Ratings
-
Alternative Data (e.g., Dark Pool activity, Market-Neutral trends)

3. Planning
TuneMap
Map past returns, simulate the future, and choose your setup
TuneMap is a no-code tool that helps you discover which technical setups work best for any stock. It tests thousands of indicator combinations, visualizes historical performance, and simulates possible futures using GARCH modeling to ensure strategy robustness.
With just a few clicks, you can explore strategy configurations based on EMA crossing, RSI, Phase Angle, MACD, and our enhanced MACD+—which features reduced lag, normalized amplitude, and a noise-filtering hysteresis zone.
-
Optimize technical strategies without writing a single line of code
-
Visualize performance clearly across time and parameters
-
Avoid overfitting with future-weighted strategy maps

Deeper Market Data Insights
Advanced DataHub Access
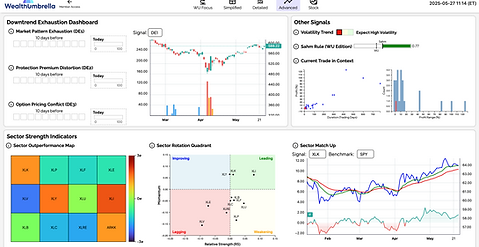
The extended DataHub new section called Advanced delivers deeper, tactical insights into overall market behavior. Built for investors who want to go beyond downside protection, it helps you assess sector strength, correction dynamics, volatility regimes, and more.
Structured into three sections:
-
Sector Strength Indicators
Identify shifting institutional flows with heatmaps, quadrant charts, and head-to-head sector comparisons. -
Downtrend Exhaustion Dashboard
Formerly our “Buy the Dip” toolkit, this section offers three advanced signals to help detect when selling pressure may be easing. -
Other Signals
Includes a volatility regime tracker, our refined Sahm Rule recession trigger, and context for the current Hedge model setup.

PAND·AI
Supervised AI Stock Analyst
Unlike standard models that lack structured reasoning, hallucinate, use stale data, or lean overly positive, PAND·AI is built with a multi-layer supervised architecture that keeps every output grounded in real institutional data and sound analytical structure.
You can now explore:
-
Company profiles
-
Company financials
-
Earnings call intelligence
-
SWOT analysis
-
Technical momemtum
-
Valuation
-
Bull/Bear thesis
All generated using real, up-to-date institutional market data and WU’s own indicators — no generic AI filler.

Additional
Advanced Features
WU Advanced Forum
-
A dedicated space for experienced members to share discoveries, ideas, and feedback
-
Exchange strategy configurations, testing results, and perspectives in a data-focused community
Access to TradingView Strategy Files and Indicators (By sharing your TradingView username with us during registration, we’ll be able to grant you access to the indicators and strategy files.)
TradingView Sandbox (Coming Soon)
-
Preview in-progress indicators not yet part of the main suite
-
Experiment with early-stage tools being evaluated for future integration

bottom of page