Bears Slowly Coming Back to Life?
- Vincent D.

- Nov 5, 2025
- 26 min read
Updated: Nov 26, 2025
---------------------------------------------------------
Last update (for real!) on November 26th 2025
---------------------------------------------------------
Last time I said it was the last update of that post. I lied! But to be honest, I felt that what I had to say about the move we made today was a direct continuation of what we discussed here, so it made more sense to keep everything in the same place.
When we got our Hedge signal last week, it came at the same time our Downtrend Exhaustion was hinting at a bounce relatively soon. We sold 33% of our holdings to align with the signal, but decided to wait for that expected bounce before moving closer to neutral. We had two motivations for waiting. The first one was simple: if a bounce was coming, why not sell the rest at a higher price? The second was: what if this bounce turned out to be the end of the correction instead?
Thursday night and Friday, we received three additional confirmations from our DE1, DE2, and DE3 signals that a bounce was underway, and indeed this week has so far been a straight week of green price action (good job, Dashboard Exhaustion — you worked exactly as intended!). Despite this bullish action, we decided today to sell the remainder of our QQQ position. We’re not necessarily pessimistic about the market, but we also don’t see the elements that would give us conviction that this is more than just a bounce.
We also think that where we are today is a level where the risk of exiting the market is relatively low: we are not that far from an unhedge signal, at which point we would have sold our QQQ position anyway to move into a leveraged product like QLD or TQQQ. And if this is just a bounce, we are effectively selling on a 0.5 retracement, only about 3% above QQQ’s all-time high daily close.
Here is our reasoning in more detail.
Bullish or Bearish?
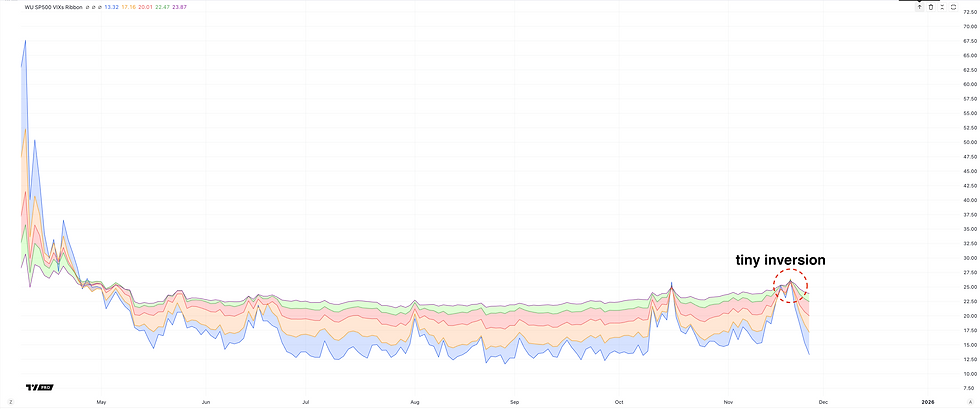
The price action over the last few days has been, without a doubt, very bullish. This has improved several of the metrics we follow. The VIX de-inverted and dropped significantly.
But more importantly, market breadth – the same indicator that triggered our hedge – has improved meaningfully for the first time in nearly two months of constant degradation.

This was welcome since, although the correction hasn’t been very strong on the index, risk-on assets have been hit much harder during that period.
But despite these encouraging developments, one thing did not happen: the option market didn’t turn bullish. In about 90 percent of cases, the option world leads the general stock market. For example, in 2022 and 2023, our option model typically curved down before corrections, but also began turning upward a few days before the stock market did.
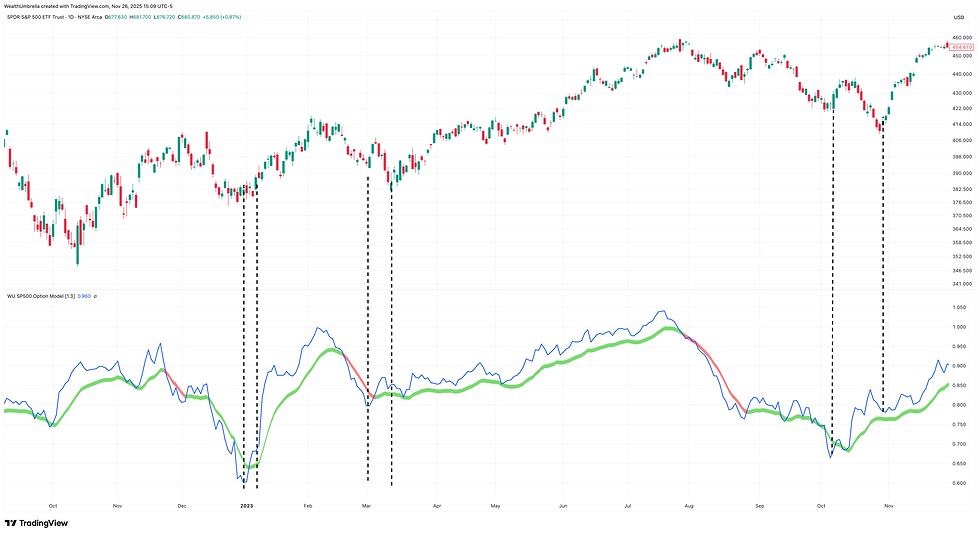
In some cases the lead was minimal, but it always at least moved upward at the same time.
This is not what happened this time. Even though Friday, Monday, and Tuesday saw a meaningful stock market rally, our option model continued to go down.

Only today did it start to rise, and even then only modestly. (If you’re curious why the option model didn’t trigger, it was a feature, not a bug — I explain this at the end.)
But the issue wasn’t limited to this model. Skew continued to rise, meaning market participants kept their protection rather than dropping hedges.

That is unusual for the end of a correction. Our NYSE and Nasdaq derivative volume has also kept falling and is about to turn bearish.

This means traders are still buying protection and are less willing to take bullish option exposure.
Typically, the end of a correction produces a significant spike down in our Option Impulse model. This model tracks the rate of change in what people are buying in the option market, and reaching its bottom threshold alone can trigger an unhedge signal. These peaks usually happen 5–6 candles after the bottom of a correction. So far, we haven’t seen any meaningful movement yet, whereas I would normally expect it to already be in negative territory.

Taken together, the behavior of all these metrics is unusual for a market exiting a correction and is much more typical of a bounce. I say unusual because in investing nothing is ever 100 percent certain. Some corrections, like the one in summer 2024 during the Yen carry trade unwind, showed a more hesitant option market due to the volatility shock of that event. But even then, the option model at least rose alongside the stock market.
Selling to Re-Enter
We obviously don’t know the future, but the way the option world behaved during this bullish move makes us think that, for now, this points more toward a strong bounce rather than the beginning of a new uptrend. That is, for us, the logical hypothesis.
There is also one technical concept we strongly believe in (and one day I should publish the blog post I wrote about this in October 2024): Fibonacci levels on the index. Without going into details, there is strong evidence that since algorithmic trading volumes have grown so much, these levels really do trigger reactions on the index. Today, when we sold, QQQ was at its 0.5 retracement and SPY at its 0.618 — classic failure points.
But the main reason we decided to take profit wasn’t because we were bearish or convinced an immediate reversal was coming. It was because we felt this was a point where downside risk was extremely limited for us no matter whether the next move is up or down. Here again is the current reading of our market-breadth-related indicator:

If the line moves below the dashed threshold, our hedge strategy will issue a “WU IN”. With the current distance, we may be only one or two good days away from that point. This threshold, when used outside a bear market (our hedge strategy does not use it in a bear), is incredibly robust. It sometimes rings a bit late, but we have never seen a simple bounce reach back above that line. So if it break that threshold, we would anyway switch our QQQ position to a more aggressive stance with leverage, as our conviction in this signal is extremely strong. So now we are 67% in cash and prepared to buy the dip if we get a WU IN, having taken profits with minimal downside.
On the other hand, if this is just a bounce, the reversal should happen very soon — before we hit that threshold. In that case we remain nearly neutral and will track this leg of the correction with our Downtrend Exhaustion Dashboard for the next dip-buying opportunity.
I hope this clarifies our decision: we are not bearish or bullish, just cautious. And we believe today represented a point where, whichever direction the market takes next, the downside was exceptionally limited given our strategy.
This probably closes this post for real.
Varia
TradingView Black Friday discount: it’s that time of the year when TradingView is heavily discounted (up to around 80%) if you haven’t seen it yet. I’m just passing along the information. I have no benefit in promoting them. In fact, our relationship has been a bit tense since the fight we had in September when they came to us asking for a lot more money.
*Why the option model did not trigger: In addition to the lines you see on the option model, there is another condition that checks how fast the option model is falling on the day it crosses its threshold, and decides whether it is worth raising a flag. In this correction, although the option model went straight down — and even began dropping before the stock market — it fell at a pace that made it “surf” on its own line for a while. When it finally crossed it, that condition blocked a signal because it determined that too much of the drop had already occurred to justify triggering. This condition greatly improves the model’s accuracy over the backtested period.
We also have a newer version of the option model (coded in July) that reconciles the Dashboard version and the TradingView version. It has a slightly different structure and a higher success rate. We haven’t published it yet because integrating it into the Risk Index has been more complex than expected and time is limited. But that version made the exact same call here — which I believe was the right one.
---------------------------------------------------------
End of Last Update
---------------------------------------------------------
---------------------------------------------------------
Third and Last update on November 23th 2025
---------------------------------------------------------
Just a quick update before we start the week.
Last Wednesday, we received a hedge signal triggered by our Market Breadth indicator. Since then, market breadth has continued to decline.

On the day the hedge was activated, we were already seeing weak signals from our Downtrend Exhaustion dashboard, suggesting that a bounce might be coming. We sold part of our QQQ position to stay aligned with the hedge, but those downtrend-exhaustion signals had us expecting a rebound.
On Thursday, the market initially opened with what looked like the beginning of that bounce, boosted by Nvidia’s very strong earnings report. But that same day turned into one of the strongest intraday reversals we’ve seen in a while. Although the close wasn’t catastrophic, the candle’s body spanned a -3.44% move on SPY from the high to the low of the day — which is enormous — and enough to shatter investor sentiment.
That same day, our DE2 triggered an orange signal, the highest conviction color level this indicator can reach.

To understand what it means, here is the signal it has printed since the beginning of the new bull market in 2023.

DE2 tracks unusual distortions in the cost of market protection — moments when investors begin overpaying for downside insurance. These distortions often appear near market bottoms or local bottoms, signaling the potential for a reversal. From that point on, it became clear to us that a bounce was likely the following day.
Friday started slightly in the red before the market finally turned higher late in the morning, closing the week on solid footing.
This bounce produced the conditions for another DE1 signal near the end of the day — the same indicator that successfully flagged the small relief rally a week and a half ago.

Meanwhile, DE3 generated another signal as well, lower than Thursday’s peak — exactly the kind of pattern I said earlier I would be looking for (a decreasing peak).

Taken together, all three Downtrend Exhaustion indicators (BTW, we updated the Advanced Dashboard yesterday, so you can now expand the graphs to get a clearer view of the history) — each analyzing different aspects of the market — are pointing in the same direction. Friday’s green candle is likely more than just a green candle. At minimum, it suggests the start of a longer bounce, if not the beginning of a new uptrend.
This candle also triggered our QQQ Bandbreaker script, which we notified you about via SMS, as we’ve done since 2023 whenever this indicator comes out of hibernation. The condition for that alert reverted near the close, but it still lines up perfectly with what the downtrend exhaustion dashboard was signaling and reinforces the thesis of a bounce early this week.
New uptrend?
For now, I still think it is too early to declare the pullback officially over. Some elements — like the quick de-inversion of the VIX — do point toward an emerging uptrend (VIX spike by waves, but usually dosent flip flop) , but that alone isn’t enough for a reliable call. Since our hedge is already active, we should eventually get a clear, robust signal that this pullback is indeed behind us, if that turns out to be the case.
Personally, I will be watching our Option Impulse signal, where I expect a sharp down-peak approaching its threshold. I will also look for a push down on the SKEW toward the low 130s, which has not happened yet. Our option model should also rebound strongly if this becomes more than a short-term bounce. And I would expect the Phase Angle to rise above 0.05–0.06. Our Hedge algo will also be monitoring other, more complex conditions.
We will track all these data points and update you as the week unfolds. In parallel, we continue to work on making our AI analyst a reality. It is now live on our development server and currently in test mode. I expect it will hit the Advanced Dashboard on December 1st, as planned. The positive news is that, since this Analyst relies on multiple AI models, we feel like we’re responsibly fueling the AI rally by shoveling money to pretty much every LLM company with all our thousands of API calls!

---------------------------------------------------------
End of Update No.3
---------------------------------------------------------
---------------------------------------------------------
Update no.2 on November 19th 2025
---------------------------------------------------------
Although the index recovered at the end of the day, our market breadth indicator continued to degrade. It is now above our threshold, and although we will get the final reading at 16:30, it would take an exceptional push into the close for it to reverse at this point.

This means our hedge signal is now on.
Our hedge signal is designed to ignore small dips while protecting against large ones. Market breadth is at the core of this strategy, and it’s very logical: big corrections tend to happen when investors collectively start to panic. When breadth becomes extremely poor, it signals that almost every investor is hurting — a setup that can trigger a much broader decline, as opposed to a sector-specific correction like in February 2021 (growth) or September 2019 (cloud/tech).
I’ve mentioned before that this signal alone has a hit rate similar to the hedge itself — around 75% successful calls. We don’t use it alone because it usually lags slightly both on the way down and on the way up, but it rarely makes a fundamentally wrong call. To help you build your own opinion, here are all historical instances of this signal since 2006:

But as the chart shows — and as the 75% hit rate implies — it is sometimes wrong, and the correction is near it's end. The Instances in 2014 and 2015 are good examples. And because it lags, it is not always the most timely signal. In some cases, it triggers not long before a relief rally (like in October 2018), and in others it can precede a major correction by a good margin — for example, it triggered on November 24th 2021, roughly a month before the brutal 2022 bear market began. But despite this, seeing it at this level now, history suggests it is something investors should be worried about.
Relief
Right now, however, we do think we are close to at least a relief rally. Yesterday we received a Downtrend Exhaustion signal from our DE3 (Option Pricing Conflict). Today’s data is not available yet, but we will likely get another reading from this same signal. In addition, we just received another signal this afternoon, this time from our Protection Premium Distortion (DE2).

This indicator has been quite accurate in the past at flagging relief rallies — including during the tariff-related correction in March of this year — and also often triggers near the bottom of smaller pullbacks.


With Nvidia about to report earnings — which, if I trust my intuition, should once again reassure markets that capital continues to flow strongly into this sector — the mix is right for an explosive rally.
What WU Will Do
As we were anticipating this correction for a while, WU has been prudently riding the market unleveraged since August, which places us in a comfortable position. Even though we expect a relief rally soon, we decided to sell 33% of our holdings (half of our QQQ position) to remain consistent with our signals — and because nobody knows the future. Our hedge model is our backtested tool designed precisely for uncertainty. This trade still closes as one of the best in the hedge signal’s history (two trades are missing from the chart because they were so good that they distorted the scale).

It is a trade that we captured mostly while leveraged.
If we do get a bounce in the next few days, we will use it to continue trimming our position. If subsequent data makes it clear that this was indeed the bottom and the uptrend resumes, we will happily use the sidelined cash to re-enter with leverage for a potential Santa rally. Otherwise, we will prudently manage our exit.
We will continue to monitor our Downtrend Exhaustion dashboard, our market breadth signal, and the SKEW. We believe that a SKEW reading in the low 130s or high 128s would be a clear sign of a renewed uptrend.
We will keep you closely informed, as we believe this is a pivotal yet uncertain moment for the market.
---------------------------------------------------------
End of Update No.2
---------------------------------------------------------
---------------------------------------------------------
Short Update on November 19th 2025
---------------------------------------------------------
Just a very quick update. Our S&P 500 Hedge signal appears to have flipped on TradingView. What triggered it is our market-breadth-related indicator, the one we were actively monitoring, which now shows as being above the threshold on TradingView.

However, on TradingView, the underlying data for this indicator is only updated (by CBOE) at the end of the day (and sometimes inconsistently during the day). When no new data is available, TradingView simply reuses yesterday’s data to calculate today’s trajectory — which is incorrect. This is one of the reasons why we built our own DataHub.
On WU DataHub, the market-breadth-related indicator — which does not rely on CBOE data but instead computes market breadth by scanning the price action of roughly 4,500 stocks — is refreshed every 15 minutes. At this moment, the actual trend is the opposite of what TradingView suggests, as the signal is moving back under the threshold.

This could hold or reverse, but in any case, if you want to monitor it during the day, please use our DataHub. For now, the current intraday trend does not favor a hedge signal today, but that could change and we will of course notify you if the hedge is triggered at the end of the day.
One encouraging sign that some of you may have noticed yesterday evening on our WU Advanced dashboard: we received another Downtrend Exhaustion signal, this time coming from our DE3, which focuses on option-pricing conflicts. This indicator typically doesn’t pinpoint the exact day of the bottom, but rather the zone where the bottom — or the local bottom before a rally — is likely to occur.

A positive sign is when the DE3 value starts to decrease. Historically, this usually means the local bottom is already behind us. We’ll continue to monitor it closely and, as always, wait for confirmation from our other signals.
---------------------------------------------------------
End of short Update
---------------------------------------------------------
---------------------------------------------------------
Update no.1 on November 09th 2025
---------------------------------------------------------
Just a quick update. Things didn’t take a bullish turn this week. If you’ve been following our dashboard signals, you’ve probably noticed that none of them have really improved. Four days since my last update, we might now be approaching the moment when a hedge signal appears.
In just a few days, our option model — which was recently at a very high level — has dropped sharply. It now sits only a few digits above its threshold.

The way it crosses that threshold line often indicates how deep the drop will go. With the current slope, unless things reverse soon, this would likely mean a significant reset for that indicator.
Our implied correlation is also extremely close to triggering. Not only has its signal inverted, but it’s now just about to reach its internal threshold. As you may recall, this internal threshold is actually quite complex, involving multiple variables — and the line shown on our dashboard is only an approximation. That said, we’re very close to meeting the flipping conditions, as shown by its current proximity to that line.

If this occurs on Monday along with the option model, our Risk Index would rise to 4 — a level that, based on backtesting, historically implies about a 75% probability that things will get worse before they get better.
We’re also seeing a notable reduction in the distance between bullish and bearish bets in our NYSE and Nasdaq derivative volume indicators.

This suggests that conviction in those markets is shifting. Sentiment has turned much more bearish than just a few days ago, and given how the options market is currently pressuring equities, this could easily translate into a significant change in the market’s trend.
This indicator is not yet in the red, which was expected — it often lags slightly when a correction begins (though not always, as we saw in summer 2024).
That’s the current state of our Risk Index and its components. As you know, this indicator is much more sensitive than our hedge model and will flip during both small pullbacks and strong corrections. It’s designed to capture the reality that sometimes even mild declines at the index level correspond to much larger moves in risk assets.
This time, however, the Risk Index is rising together with one of the hedge model’s main components. At this pace, we could very well see the hedge trigger early next week — unless we get a rebound, which would be significant news.
Indeed, our market-breadth-related indicator has been climbing steadily toward its threshold over the last two weeks, not pausing even on days when the market printed green candles.

This means that an increasing number of tickers and sectors are underperforming — a setup that often leads to a snowball effect. As I’ve mentioned before, this indicator alone acts as a reliable hedge, showing roughly the same hit rate as the hedge algorithm itself. It never misses a strong correction. See for yourself:


Put simply, the other nine components of our hedge strategy are there to help us anticipate downturns faster — and perhaps even more importantly, to detect the end of a correction before the breadth-based indicator does, since that one tends to lag significantly on the exit. Having redundancy also strengthens conviction. For example, in February of this year, we reached a point where three internal hedge components had already raised a flag.
Path Forward
As mentioned above, most of our metrics degraded significantly last week, and we’ve reached a point where things look increasingly bearish. However, there are still a few rays of sunlight suggesting that the long-awaited full-blown correction could be delayed — and that we might instead be seeing the setup for a rebound, or a correction that remains just a blip on the index while already causing damage in riskier assets.
First, the Skew remains low by historical standards. It hasn’t risen during this correction, nor cooled down significantly, but it still sits at a relatively low level compared to recent months — roughly 45 points below where it stood before the tariff correction and about 15 points below the range where it was stuck for most of August, when the market began that month with several red candles.

VIX also didn’t invert and actually began to decline on Friday afternoon across all durations.

The move down may appear modest, but the difference between this and how sharply it was rising earlier on Friday is significant. It was clearly on track for an inversion, yet it has now started to cool down across all timeframes.
Historically, it’s also quite rare for our market-breadth-related indicator to fall from a yearly low (bullish) all the way to the hedge threshold in a single move, except during black swan events — which, at the moment, we’re not experiencing.
And finally, on Friday, we recorded our first Downtrend Exhaustion (DE) signal since April (formerly known as our Buy-the-Dip signals). It came from the DE1 model — the same one that flashed a strong red signal on April 7th, the day we saw the bottom of the tariff correction. At this point, it’s showing a blue signal of small amplitude.

As a quick reminder, DE1 produces three levels of signal strength, from weakest to strongest: blue, orange, and red. Red appears only every two to three years during major corrections. The others depend on the correction’s strength. Given the current realized volatility, which has remained well-contained so far, a blue signal is exactly what we’d expect — consistent with what we’ve seen in several smaller pullbacks:

We have three different Downtrend Exhaustion signals, each looking at different areas of the market. The DE1 signal identifies moments when a correction or multi-leg downtrend begins losing momentum, using a combination of price structure (across multiple timeframes), trading volume, drawdown depth, and realized volatility.
The reason we designed multiple DE signals is that each is intentionally restrictive — we prefer a model that misses a signal rather than one that triggers without cause. In this context, redundancy becomes essential.
When we talk about weaker signals, like a blue one, they don’t always capture the exact bottom of a correction but consistently flag moments when the market is near a potential bounce. A good example is the summer 2024 correction. Just before the B-wave bounce, we had a weak blue signal (value around 10). The market then rallied for about five days before starting its C-leg. On Friday, August 2nd, we had another blue signal — this time of much stronger amplitude (value around 60). Everything that day pointed to the end of the correction, and it likely would have been if not for the black swan event that followed on Sunday night — the yen carry trade unwinding, which triggered one of the largest VIX spikes of the decade.
Even so, the next day the market opened sharply lower but immediately rebounded, printing a candle that ultimately marked the bottom of that correction — accompanied by a strong orange signal from DE1.

You can learn more about our Downtrend Exhaustion signals here
Conclusion
In summary, the market has deteriorated considerably since my last update only a few days ago. We’ve now reached a point where both our Risk Index and our Hedge Signal are very close to their respective thresholds and could trigger at any time. These thresholds are designed as the optimal dividing lines — separating periods where markets tend to recover from those where things typically worsen. It’s not unusual to see prices reverse right at these levels. In other words, being positioned right at that door means we must be ready for either scenario.
At this point, the appearance of a blue signal in our Downtrend Exhaustion indicator — even if it’s a weak one — is a positive sign, suggesting that we might soon see at least a short-term bounce, which could delay the hedge signal. If that happens, we would simply continue to ride the market until it reverses and the hedge signal confirms.
Over the next few days, our main focus will be on the components of the Risk Index, the Market Breadth indicator, and the Downtrend Exhaustion Dashboard. What these signals do in the short term will determine our next steps. If we do get a hedge signal, we’ll follow it without hesitation — unless it coincides with a strong orange DE1 signal, which is unlikely but not impossible.
If this scenario unfolds, it would mark the conclusion of a very successful trade for the hedge signal, one where we would have captured roughly 80% of the move with leveraged exposure (UPRO and QQQ) and the remainder through non-leveraged positions.

We’ll keep you informed by updating this post soon. We’re at a crossroads — the path forward is uncertain, but clarity should come quickly.
---------------------------------------------------------
End of Update no.1
---------------------------------------------------------
The market didn’t have a good day today. After last week’s strong gap-up driven by impressive earnings from the major AI players, it was inevitable that earnings-related volatility would eventually swing in the opposite direction.
Today’s weakness seems to be the result of several overlapping factors: a wave of AI-related layoffs over the past few days, disappointing employment data from Indeed (since we still have no official data due to the government shutdown), concerns about tomorrow’s court hearing in the tariff case, and Palantir’s earnings yesterday, which reignited fears of overvaluation among the major AI names.
Price action wasn’t catastrophic at the index level — the S&P 500 (SPY) closed down a reasonable -1.19% — but the Nasdaq (QQQ) saw a steeper -2.07% decline, reflecting where most of the overvaluation anxiety is concentrated. A look at the S&P 500 heatmap confirms that tech was the main culprit, explaining why today’s gap between QQQ and SPY performance far exceeded their normal beta relationship. While tech-led risk assets sold off, more defensive sectors of the S&P 500 held up relatively well.

Despite the pullback, both major indices remain close to their all-time highs. Investors positioned in them are still wealthier today than they were two weeks ago — or at the end of almost any other month this year.
However, outside the major indices, things look more concerning. For investors with higher exposure to risk assets, today may have felt like the cherry on top of a very bad sundae rather than just a minor hiccup. Market breadth has been slowly but steadily deteriorating for the past three weeks.
On Friday, October 10th — after the market’s sharp -3% “tariff déjà vu” sell-off — I mentioned that I didn’t expect an immediate correction, even though many were calling for one and valuations could have justified it. The main reason was that our indicators were still sitting in overly bullish territory — too high for a straight “elevator down” move. Going down quickly and deeply is not the market’s normal regime — it’s a failure mode, and it requires an alignment of multiple factors. One key metric, our Market Breadth Indicator, had just printed a yearly low, meaning that this was when the largest number of companies were performing well simultaneously.
Sharp market crashes are driven by panic — and panic tends to occur when two conditions align:
Investors suddenly fear the collapse of the world or its economy (examples: COVID in 2020, the Fed’s rapid rate hikes in 2022).
There are no remaining “pockets of strength” — when every stock seems to be falling at once.
When that happens, everyone loses regardless of what’s in their portfolio, which fuels panic selling. Historically, that’s a sine qua non condition for deep corrections.

For instance, in 2022, while the market officially began its crash in January, our Market Breadth Indicator had already flipped to hedge mode by late November 2021. Similarly, during the tariff-related correction earlier this year, that signal reached its danger threshold at the end of February, when the S&P 500 was only -3.1% off its highs. In both cases, it foreshadowed the real damage.
In short, history shows that major “elevator-down” corrections typically only begin once that indicator hits dangerous territory. While we were far from that level on October 10th, the situation has changed — market breadth has now degraded significantly.

This deterioration is mirrored in our Implied Correlation Signal, which reflects a similar concept in the options market. This indicator measures the divergence between index volatility (S&P 500) and the volatility of its individual components. Normally, the two move together — but when fear rises in individual stocks, they begin to diverge. That’s exactly what we’re seeing now.

So, we need to acknowledge this de-risking phase. The implied correlation is very close to flipping red, which would raise our Risk Index to level 2. However, our market breadth indicator still sits comfortably above its hedge threshold. This isn’t a contradiction — implied correlation feeds into our Risk Index (which is designed to detect smaller risk shifts that affect high-beta assets outside the main indices), while market breadth is part of our Hedge System, which only triggers in the case of major corrections.
Outside of these warning signs, most of our other indicators remain relatively positive.
Our Option Model remains elevated and didn’t drop much today, even with the tech sell-off.

The spread between bullish and bearish options remains wide — still clearly favoring the bulls.

This tells us that sentiment in the options market remains far from panic and, in fact, still fairly optimistic.
Even though the Skew Index ticked up slightly today — signaling a modest rise in fear — it remains low by the standards of the last four years, having recently bounced off a local low of 139 late last week.
Wrap-Up
So, what should we make of all this? We’ve been quieter lately because we’re at one of those crossroads where certainty meets uncertainty.
Our certainty is clear: the market is overbought, valuations are stretched, and we are well overdue for a correction. That’s precisely why, at the end of the summer, we shifted our leveraged exposure back to a non-leveraged position. We know that, at some point not too far ahead, we’ll have the opportunity to re-enter the market with leverage — at a discount relative to today’s prices. That’s the part we’re confident about, and it’s what we’ve been consistently repeating lately.
The uncertainty, however, lies in timing. Every backtest we’ve ever run confirms that it’s nearly impossible to consistently call the exact top of a bullish leg. In a strong uptrend like this one, momentum can persist far longer than logic would suggest. What we do know is that, eventually, our hedge system will flash a clear warning — signaling that the elevator might be heading down. This may not be the top, but when it comes, we’ll act decisively — exiting positions, sending SMS alerts, and publishing an update. We’re just not there yet.
Today’s setup isn’t as bullish as it was back on October 10th, when our full suite of metrics gave us confidence that a deep correction wasn’t imminent — despite that day’s sharp sell-off. Now, our tone is more cautious, especially toward riskier assets.
If I had to speculate, I’m not convinced we’re heading straight into a full-blown correction just yet. Market breadth rarely falls from yearly highs directly to hedge-triggering levels in one move. It usually comes in waves — back and forth — that gradually bring it down. For nearly a month now, risk assets have already been in correction mode. The next move might briefly favor these beaten-down names. As valuations among large caps become increasingly unattractive (if not outright repulsive), investors might start rotating into smaller, discounted plays.
Another potential short-term catalyst could come from the Supreme Court, which begins hearings tomorrow on the so-called “Liberation Day” tariff case. While this likely won’t end the saga, even a temporary reprieve could be viewed positively for smaller companies.
Still, all this remains speculation. The reality is that, despite today’s large red candle on the Nasdaq — and to a lesser extent on the S&P 500 — the options market and most of our other indicators aren’t yet positioned for a major breakdown.
When that changes, you’ll know — we’ll keep you informed. Until then, we’re comfortable maintaining our current moderate-risk positioning, including on Bitcoin, which we believe is finally undergoing the correction it needed. With Bitcoin now down nearly 20%, this move looks much more in line with what we typically see at this stage of a bull cycle.
A drop toward the 95K level would still fit within the range of a normal pullback — consistent with late-stage bull market behavior. We actually think we’re now closer to a major bottom than to the beginning of something larger. We’ll share a dedicated update soon, once the latest on-chain data becomes available, as today’s readings have not yet been fully released.
Varia
While the market has been relatively calm lately, that’s given us some time to focus on a project we’ve been quietly working on for a while — bringing a real AI inside the WealthUmbrella Dashboard. In the not-too-distant future, I’ll write a full update about it, but considering that I’m a professor who actually does research in AI, it was about time WU had this:

(it's just our internal code name).
Why bring AI into WU?
Because investors are already using AI, but there’s also a slightly scary side to it
I recently read that more than 25% of younger investors now rely primarily on AI for their investment decisions. The problem is that when you ask most public AIs about a company, they tend to regurgitate incomplete facts, often based on outdated data from their training period — and they rarely offer real insight. Even worse, they sometimes hallucinate with absolute confidence, which makes it hard to tell what’s true and what’s made up. Just try the new Yahoo Finance AI Analyst and you’ll see what I mean — it’s often a random list of loosely related facts. Perplexity’s finance module is better, but still far from what I knew we could build. I trained my first neural network back in 2003, and I knew we could do something far more robust.
So, we’ve been secretly developing a multi-model AI trained on institutional-grade data — including our own proprietary datasets — and supervised by a “committee” that prevents it from fabricating random facts. The goal: provide deep, reliable insights with the kind of analytical quality you’ve come to expect.
Because our members fall into two very distinct groups.
Some of you — especially our long-term and tech-savvy members (thank you for being with us all these years) — can’t get enough data. The more we add, the more you dig in. I’ve even seen some of you build genius personal strategies using our metrics.
On the other side, we have members who find the amount of data overwhelming — especially newer investors still learning how to interpret our indicators. And I get that. The learning curve can be steep. Earlier this year, I mentioned that we were planning better onboarding videos to help with that, but now we believe AI might actually be the better solution.
What we’re building is a conversational AI that you’ll be able to poke (no chatBot) directly within the platform to get a personalized interpretation of our data — one that reflects how we would read it.
Our first step is to integrate this into the Stock Health Dashboard. That’s partly why we recently added the “Valuation in Context” module — to give the AI not only the current data but also the full historical context it needs to interpret it accurately.
For example, with a simple click, you might soon be able to ask for our AI’s interpretation of Fiserv’s technical trend — and it would respond with something like this:

(That’s actually a test we ran last week to see how quickly our AI committee could assess Fiserv’s sharp downtrend. )
Or ask what we think of Apple current valuation:

Step 1 will be AI integration into our Stock Health section, since that’s an easier environment — most of the metrics are already well understood by the system. It’s also a pivotal stage in the investment process: evaluating whether a company is worth investing in.
Step 2 will connect Pand.AI to our S&P 500 market signals, allowing it to generate a proper market interpretation. My ultimate goal is that you’ll be able to ask for — and receive — a complete market update whenever you want, even if I haven’t written one that day.
(Did you really think a Robotics and AI professor wouldn’t automate himself? Just kidding — it’s not replacing me, just adding to what I have to say.)
We expect you’ll start seeing Pand.AI appear in the Dashboard around the end of November. Once it’s ready, we’ll of course post a detailed announcement.
Varia 2
I recently passed some tests that confirmed what I had anticipated — my health is almost fully back to 100% (50 EV for our cardiologist member that told me I would be back to 55% in no time). The improvement has been significant enough that I feel completely normal again and can even run at a decent pace.
This closes a rather difficult chapter of my life — one I would have preferred not to experience, but which ended up being philosophically insightful.
I’m mentioning it here for a few reasons:
Many of you have written to ask how I’m doing.
I’ve received a lot of kind emails from members checking in, but since all this happened, my inbox has gotten a bit out of control. So for those who’ve asked — here’s the update.
To say thank you again.
When I first shared what happened to me on July 28th, I received so many thoughtful messages and personal stories. Those words genuinely lifted me up at a time when I wasn’t feeling my best. People who know me would say I’m usually in a good mood — that period was an exception, and your encouragement helped more than you might think.
And finally, to close the loop.
When I first shared what had happened, it was because my doctors warned me that I might struggle during treatment for heart failure, and I was worried I’d have to step back from some of my projects. Fortunately, that phase turned out to be only temporary — and I actually managed to keep working almost as much as usual.
So, now that I’m fully back to normal, I don’t expect my health to interfere with work anymore — and I’m just grateful to be back at full speed.


@vincent From the positive move across our signals sensing a turn to WU-IN shortly. Are you seeing anything that gives you pause?
Market Breadth - Dramatically improved
Option Model - Rising (0.91, recovering from lows)
SKEW - Declining (143, down from 155+, approaching 130s target)
Option Impulse - Spiked down (-0.32, showing bottom pattern)
Implied Correlation - Improved (in green/bullish zone)
Phase Angle - Above threshold (0.13 vs. 0.05-0.06 target)
Hi Got a text messahe WU SPU00 - WU sold its 34% QQQ position at 615.01. Blog update incoming.
Any isea when we should expect it?
Vincient: The Dashbaord is showing WU In? Can some body please confirm.
Hi Vincent:
Thanks for the very deatiled update. Is there a blog on your site that expalins all these indicators it will help all of us to be self sufficent.
THANKS FOR THE GREAT WORK AND INSIGHT
Thanks for updating again. Could someone provide a little more guidance on how to handle the DEI signals? Concerning stop loss one could use the latest low before the signal but how about profit taking? If it's a new uptrend and the hedge becomes green, all is good. Just ride the new hedge signal. But what if it's just a small bounce? It will be too short for some kind of trailing stop and also below the moving averages one would typically use. So how do we get out of the bounce? Any idea will be appreciated.