Market Ready to Run, But Running Out of Space
- Vincent D.

- Aug 25, 2025
- 9 min read
Updated: Sep 3, 2025
---------------------------------------------------------
Update no.1 on September 03th 2025
---------------------------------------------------------
Hi Folks. Just a quick update on an issue some of you noticed. On Monday, while the stock market was closed, both our Option Model and Hedge Signal repainted Friday’s value on TradingView, which made it look like both had triggered.

This was caused by a CBOE data feed that, on rare occasions, behaves oddly during market holidays. Some of our longest-standing members may remember similar glitches a few years ago. In fact, one of those incidents was part of what motivated us to build and run our own DataHub.
To be clear, neither the Hedge Strategy nor the Option Model ever came close to triggering. The official CBOE data (from their website) and our DataHub feed both looked perfectly normal and confirmed that Friday was just a regular trading day for those metrics. Even stranger, the paid real-time CBOE feed on TradingView also remained unaffected.

For context: TradingView offers two types of CBOE data — the free feed, which runs on a 15-minute delay, and the paid real-time feed. I subscribe to the real-time feed so our strategies and alerts are always accurate at the close. Since my real-time data was unaffected, my models didn’t repaint and no alerts triggered, which is why I wasn’t aware of the problem until some of you flagged it.
It looks like TradingView has now corrected the data across all feeds. Still, this episode is a good reminder of why we rely on our DataHub as the ultimate source of truth. Whenever our Hedge Strategy flips — and it’s valid — it will always be reflected on the DataHub and trigger the proper alerts.
The Option Model is a bit trickier. Because it’s highly non-linear, small data differences can sometimes lead to divergent signals between TradingView and our DataHub. We’ve been actively working on this and have finished building a new version of the Option Model.
The new model uses zero-lag EMAs, which makes it more responsive and, in many cases, a few days faster than the current version. This has significantly improved its stats — to the point where it now outperforms the rest of the Risk Index on its own.

Our next step is to apply similar improvements to the other components of the Risk Index so we can restore and even enhance the synergy among all three. If all goes as planned, we hope to roll out these updates by Friday. We are a bit slowed down by the fact that we are also working hard to launch our New Bitcoin datahub for Friday. From that point, the DataHub will become the single reference for all our signals, even though we’ll still maintain and update the TradingView versions in parallel.
We’ll also get back to you very soon with a full market update. That being said, if I had to summarize my thoughts in a single paragraph, our view remains that the market is not yet set up for a bearish run, and most data still support this outlook. However, as long as the SKEW stays stuck above 150 and doesn’t see a meaningful cool-down into the very low 140s or below, the stock market is likely to keep zigzagging without a clear direction, while awaiting catalysts such as the upcoming jobs report on Friday.
---------------------------------------------------------
End of Update no.1
---------------------------------------------------------
The market went through a moderate series of red candles last week. Although price action looked bearish, the options market didn’t confirm the move. Some of our option metrics weakened slightly, but none came close to flipping back to red. The biggest positive surprise came Thursday night, on the eve of Jerome Powell’s speech at Jackson Hole, when the SKEW—which had been holding up stubbornly—finally cooled off by 10 points.
That didn’t surprise me. It reflected the lack of fear already visible across most of our option signals, and it lined up with what we expected Powell would be forced to sound like: dovish. Contrast this with Jackson Hole in summer 2022, when Powell struck an extremely hawkish tone as markets were rallying, because the Fed was united in wanting to tighten liquidity to fight inflation. This year, the backdrop was completely different. The Fed had already signaled multiple times that rate cuts were coming in 2025, and with September being the ninth month of the year, there weren’t many meetings left to deliver them. On top of that, the latest FOMC meeting had shown the most dissent within the committee in decades. In that context, sounding hawkish would have meant ignoring a considerable portion of his colleagues. Powell has always defended Fed independence from government, but he has also consistently respected the collegial nature of the institution. Add to this a string of softer economic data, including the jobs report pointing to a weakening economy, and the stage was set for a dovish Powell.
And that’s exactly what happened. Just minutes into his speech, Powell indicated it was highly likely the Fed would cut rates in September. The market loved it. In a matter of minutes, equities recovered nearly everything lost over the prior five trading days, making it one of the most euphoric sessions we’ve seen in a while. Unsurprisingly, the following day was choppier—markets flipped between red and green before closing slightly down. That’s perfectly normal after such a surge.
The real question now: was Friday’s move just a fake-out, or the start of a new up-leg?
Expensive Market
The Shiller CAPE ratio, which is the Cyclically Adjusted Price-to-Earnings ratio comparing stock prices to average inflation-adjusted earnings over the past ten years, is now at a level only seen during the Dot-com bubble.

Some argue that in today’s tech-driven world—where growth outpaces most other sectors of the S&P 500—comparing earnings to what they were decades ago is less meaningful. In growth markets, investors often turn to price-to-sales ratios. But that doesn’t improve the picture either, since on this metric we are also sitting at a two-decade high.

That said, I wouldn’t use valuations alone to time the market. Stocks can remain expensive for years while still climbing higher. For example, the S&P 500 surpassed its 1998 PE ratio (the traditional one, not Shiller-adjusted), and an investor entering then would still have made significant gains until the Dot-com bubble finally burst.

We don’t claim that history will repeat itself, but it does remind us that valuation is not a timely signal. What it does provide is context: it tells investors clearly that stocks are not trading at a discount.
This aligns with the fact that the market is hovering near all-time highs, which helps explain why it struggles to push higher with consistency. As a comparison, after Powell’s dovish press conference in October 2023, the market rallied for 18 out of the next 19 sessions, printing four large gaps along the way. Today, we’re seeing more hesitation, with the market reluctant to move into that same level of exuberance.
Still, the signals suggest the market wants to rally…
Green Light?
As we noted at the start of this post, all of our option-related metrics stayed in the green last week and even improved on Friday. Our NYSE and Nasdaq derivative volume has maintained considerable width, signaling continued strength.

Our implied correlation indicator, after ticking up briefly, has since resumed trending lower.

Meanwhile, our Option Model has also cooled off while remaining bullish, leaving considerable room before it reaches the top of its range.

On top of that, our market breadth indicator—an essential input in our hedge strategy—resumed trending downward after a short pause that had raised some concern.

Looking back at the 2023 and 2024 runs, breadth still has room before hitting the extreme overbought levels that usually mark exhaustion.
We’ve also heard concerns in several places about the VIX being “too low” now that it has fallen back under 15. It’s true that, compared to last year’s standards, a sub-15 VIX looked like an extreme reading often tied to reversals. But historically, 15 is far from a low value for the VIX. In fact, our WU ADV Volatility Trend Indicator flipped red in late July 2024, marking the start of a high-volatility environment that brought several sharp VIX spikes and kept levels consistently above 15.
As we pointed out about a month ago, this high-volatility phase had already lasted longer than the historical average of similar episodes over the last two decades. That suggested we were due for a reversion—and indeed, over the past few weeks, the indicator flipped back to green. This doesn’t mean we won’t see more VIX spikes, but it does imply that the broader environment should shift toward lower volatility.
Looking at past green periods like 2023 and 2024, the VIX (orange curve) still has plenty of room to cool further from here, and its current level is far from “too low” in that environnement.

Prudence
All signs point to the market wanting to rally, and none of the metrics we’ve reviewed are at extreme levels, which suggests there is still room for another leg up. But we started this post by noting that valuations are stretched, and that could make this rally more difficult to sustain. Since April, the market has mostly rallied straight up without a meaningful pullback, and this could be the last push before a larger correction.
I don’t want to sound apocalyptic. We could certainly build a very bearish scenario out of the current weakness in employment and PPI, but the lesson of 2023–2025 is that bearish macro narratives often fail to materialize. More realistically, the market could stage another leg higher, followed by a standard 6–10% pullback before resuming the trend.
What makes us cautious is a pattern we’ve observed in the options market: with each wave of this rally, traders are holding onto more downside protection. Our Option Impulse signal, which we use in our hedge strategy, reflects this clearly. Normally, a large impulse down marks the reshuffling that follows a major correction, like before the powerful October 2023 rally. Smaller impulses can still support rallies, but lately, each consolidation has generated weaker and weaker impulses, showing that investors are reluctant to drop their hedges.

We see the same behavior in the SKEW. After cooling by 57 points in April (from its February high during the tariff feud), it bottomed at 126. Since then, SKEW has been printing consistently higher lows with each wave. Last week it cooled by 10 points, but only down to 144.32.
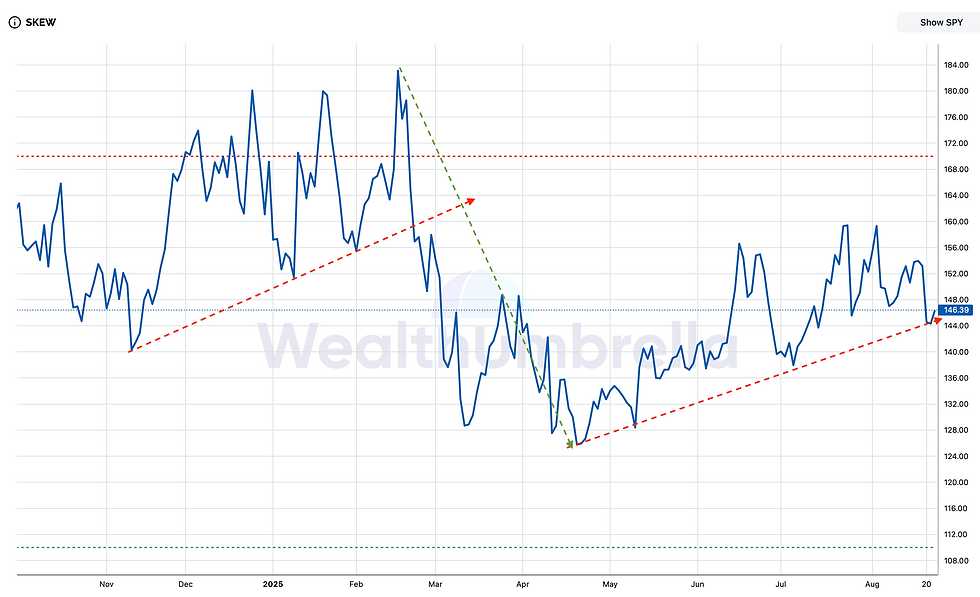
This is a typical pattern: during the November 2024–February 2025 stretch, SKEW also made higher highs and higher lows as investors grew increasingly cautious, unwilling to part with downside protection even as prices climbed. By definition, the CBOE SKEW reflects the asymmetry between bearish and bullish option bets. A reading of 100 would mean balance, but that never happens because downside risk always dominates. In extreme bear markets like 2008 or 2022, SKEW fell toward equilibrium because there was little downside left. Today, the opposite is true: SKEW is telling us there may not be much upside left before protection kicks in.
That said, while the trend in the SKEW is concerning, absolute levels aren’t extreme. Unlike earlier this year, when SKEW hit an all-time high, today’s readings aren’t wildly bearish. If anything, they point to a normal pullback rather than an abyss. Still, this should be taken with caution: market narratives can always override SKEW, just as they did in early 2020 when SKEW was high but vastly underestimated the COVID crash.
Finally, the current sector rotation has pushed technology out of favor in exchange for areas we typically see gaining traction toward the end of a cycle—utilities, consumer staples, energy, and materials.

Rotations like this don’t only occur at cycle tops and litterature are a bit split on that topic, but seeing these exact sectors improving at the same time still warrants prudence. It’s a reminder that while the market may continue to rally, leadership is shifting toward more defensive and late-cycle areas.
Conclusion
Most indicators still give the market a green light to rally, but stretched valuations, nearly five months of uninterrupted gains, and the steady buildup of downside protection in the options market all point to possible buyer exhaustion—particularly among the big names in the S&P 500. That’s why we re-entered recently with non-leveraged positions in SPY and QQQ: we want to participate in this market, but with prudence. For now, we’ll hold back from adopting a more aggressive stance until we see stronger bullish confirmation. Adding to our caution, our Margin Signal recently peaked at 14, a level that has historically suggested limited upside remains before a meaningful correction sets in.
I do believe the market can carve out another leg higher, and we should benefit from it in the near term. But I wouldn’t bet the house on it—at this stage, it feels more like a “sell the rip” environment. For now, we’re comfortable being a bit more cautious while continuing to monitor the data closely.
Varia
Health: First of all, thank you for all your kind words regarding my health. I shared my situation mainly to explain why Zack will be more in front over the next couple of months, but I was truly uplifted by your replies. Your positive thoughts, supportive messages, and even sharing your own health journeys encouraged me more than I expected at a time I needed it most. I apologize if I haven’t managed to respond to everyone individually—between hospital visits, work, and trying to rest, time has been limited—but I’m getting better every day.
Bitcoin: After Friday’s bounce (the B wave), we now appear to be in the C wave of the current correction. I continue to expect this correction to bottom near the 106–108 range, as I mentioned in a recent post. In my view, the correction was largely triggered by ETH, which had reached extreme overbought levels, and I think it’s now due to step back and give Bitcoin its turn to lead the next phase. This type of rotation was seen several times in 2020 and 2021.
I’ll share a more detailed update soon, but the key point for now is that we’re actively building out the Bitcoin DataHub. Progress has been excellent, and we’re aiming to have it live early next week.


Nice job on the Data Hub WU!
Looking like the dip is still being bought, on the watch!
Thanks Vincent for the update.
How does the hedge signal being generated for each TV user? Does it depend on each one's TV data subscription? Asking since this signal should be the same for everyone, could it be calculated based on WU TV data (which has realtime CBOE) and then push to everyone so that this does not happen?
I am seesing WU Out and Breaish Signal on Options on the trading view. Can some body pleqse validate what I am seing:
WU OUT on TradingView???