Bitcoin Breaks Free — Where Is It Heading Next?
- Vincent D.

- Jul 11, 2025
- 9 min read
Last time we posted about Bitcoin, our stance was that—even though it had just hit a new all-time high, which is typically a very bullish signal—it wasn’t yet ready for the next explosive phase. This view was based on the supply-demand equation, which, while healthy, wasn’t in the kind of coiled setup we’ve often seen before major breakouts. In line with that assessment, Bitcoin didn’t move much afterward. It traded sideways throughout June, and that range extended into the beginning of July. A natural thought was that Bitcoin might continue this pattern of summer consolidation, as it has done in recent years during that season.
That scenario could’ve easily played out. But this week, things started to shift. The imbalance between supply and demand became increasingly pronounced—just as Bitcoin was approaching the apex of an ascending triangle. It became clear that Bitcoin might defy its usual summer lull and break out instead. That’s what we flagged on Twitter two days ago. While we didn’t have full certainty at the time, the odds tilted in our favor—and Bitcoin broke out. As of writing, it’s hovering around $117,500.
In this post, we’ll take a look—through several lenses—at whether this move is already exhausted, and if not, where it could potentially take us next.
Supply and Demand Balance
A little over a month ago, our view was that supply and demand dynamics were healthy, but not tight enough to trigger a strong move. That picture began to shift at the start of July.
On the supply side, long-term holders (HODLers) have been consistently stepping back—stopping sales almost instantly when price stops pushing or retraces.

On the demand side, ETF inflows continue to balloon. After a month of declining volume, we’ve now seen several weeks of steady inflow growth, with most of it going into IBIT, which currently accounts for 85.34% of the assets in U.S. spot Bitcoin ETFs.

This is also happening at a time when retail participation in Bitcoin has been rising sharply and steadily since March.

Additional pressure became apparent about a week ago, when we broke the downtrend in newly created addresses with a non-zero starting balance.

That said, in absolute terms, this segment of the Bitcoin ecosystem is still very far from euphoric—historically, it remains at very low levels. We’re not surprised: for many, it’s now easier to gain exposure through ETFs than by setting up an on-chain wallet. Still, seeing this metric begin to trend upward is encouraging—it suggests a strengthening uptrend that hasn’t yet hit full steam.
Overbought ?
At this stage, the supply and demand equation for Bitcoin looks very bullish. It was the primary driver behind the recent move, which was further amplified by the liquidation of a significant number of short positions yesterday (around 1 Billion of shorts got liquidated). That said, the current balance is still far from euphoric—which is not only expected but healthy at this point. We actually anticipate this dynamic will continue to improve in the coming days as bullish price action brings more participants back to the market. We’ll monitor this closely and keep you updated.
Unless we start seeing a clear loss of momentum in this balance, our view is that the move we’re witnessing isn’t exhausted—it’s more likely the beginning of something bigger. Of course, after a $10K+ surge, some short-term consolidation wouldn’t be surprising. But rather than a true pullback, we’d expect a pause or slow grind, which has been Bitcoin’s typical behavior after recent breakouts.
With that in mind, the question becomes: where could this move take us?
One of our best tools for navigating the near term is our MLDP Z-Score model, which has served us well over the years in identifying local tops. For those unfamiliar, this model measures how far Bitcoin’s price deviates—in standard deviation terms—from the valuation derived from our version of the Metcalfe Law model. Metcalfe’s Law states that the value of a network is proportional to the square of its user base. WealthUmbrella’s adaptation of this model has historically done a solid job identifying both local and cyclical tops.

As of now, the MLDP Z-Score sits at 1.8. Historically, most strong Bitcoin moves push the model up toward the 3 standard deviation range. While it’s difficult to predict the exact price that corresponds to that level (since the model is path-dependent), we simulated various scenarios to get a sense of where that could lead us.
We modeled three levels—2.5, 3, and 3.5 standard deviations—under different timeframes. The most extreme and unrealistic case is a single-day spike to those levels. More realistically, we looked at past cycles and found that it typically takes about 30 days of upward movement with minor pullbacks to climb from 1.8 to 3. In faster cases, Bitcoin managed the move in just 8 days of steady grind.
The table below presents estimated price levels for each of these scenarios:
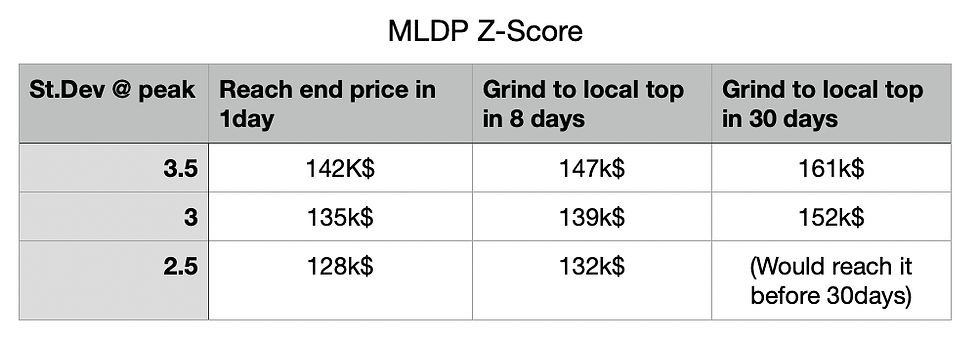
From these simulations, a move topping somewhere in the $132K to $140K range would not be out of line with historical precedent. This is slightly above our previous target of $120K to $130K, but Bitcoin has spent more time consolidating than expected, which has created the conditions for a stronger continuation.
Cyclical Top: To Be or Not to Be?
Since the cyclical low in November 2022, we’ve consistently said that each rally wasn’t the one that would take us to the top of the cycle. Our confidence came from our various Market Top indicators—tools we trust because they’ve been normalized to provide consistent readings across different cycle tops and bottoms.

What makes us even more confident is that these indicators each measure very different aspects of the Bitcoin ecosystem, reducing the odds that they would all fail at the same time. If they ever did, it would likely mean Bitcoin itself had fundamentally changed—not that we suddenly forgot how to code.
In all previous rallies since 2022, our indicators were far from signaling a top. So we never hesitated to say: this isn’t the peak. But this time, as several of them inch closer to euphoric levels, we can no longer rule it out. Nothing is flashing red yet, but we’re keeping a close eye on:
· Kwiatkowski Market Top Signal
· MRHR Top Indicator
· Exchanges Money Flow Top Indicator
· MVRV (not ours, but we’ve published a TradingView version)
One way to evaluate how close we are to a top is to simulate what the Bitcoin price would need to be for these indicators to hit their thresholds. This isn’t simple—it’s highly path-dependent—but we tried it back around Christmas 2023 and came up with an average cyclical top target of $172k, in a range of $144k to $200k. Those estimates involved big assumptions, but now, nearly two years later, we’re in a much better position to revisit them with more realism.
Some predictions from our original model were quite close—for example, our Thermocap floor projection for fall 2025 was $33k, and it’s currently at $32,847. Others were more off, like our expected realized value of $44k—it’s already at $49k.
This time, we successfully inverted the equations behind two of our models and one well-known model from David Puell (Cathie Wood’s best soldier): the MVRV.
Simulation
After failing to invert our Kwiatkowski model back in 2023, we finally cracked it. We ran two scenarios: one with the indicator peaking at 35 (a historical euphoric zone), and another at 40 (an extreme zone).

These scenarios led to:
· Average BTC price of $203k (range: $192k–$214k) for a 35 reading
· Average BTC price of $224k (range: $213k–$235k) for a 40 reading
Next, we revisited our model based on the Thermocap price floor. Historically, cyclical tops have ranged from 5x to 7x this floor. Based on today’s values, that leads to a range of $197k–$262k with an average of $229k.
For the MVRV (Market Value to Realized Value), we project a top at a ratio of 3.1 if the cycle ends this fall. That differs from Cathie Wood’s team, who missed the last cycle top by not adjusting for the declining amplitude of MVRV across cycles.

Using different projected realized values near a potential top, our simulation gives a price range of $184k–$221k, with an average of $202k.
Here’s a summary table of all the projections:

Overall, the results align remarkably well, clustering in a range between $203K and $229K. The average projected price for Bitcoin at the next cyclical top is $214K.
What do these simulations tell us?
I know the previous section may have been a bit technical for some of you. We talked about simulations, equation inversions, path dependency, and assumptions on key variables. If that was confusing, that’s perfectly fine—the important part isn’t the math itself, but rather what it allows us to conclude.
All of these different models converge toward an average price top around $214K, inside a relatively tight range. This strongly suggests that the current wave is unlikely to be the final leg of this cycle. That doesn’t mean we won’t be watching our Top indicators closely from here—but if they behave as expected, we should see a pullback before reaching their full euphoric readings.
The price range that would bring our MLDP Z-score model to 3 standard deviations (roughly $132K–$140K) is significantly below the estimated cyclical top. This supports conclusion #1 and confirms that our primary focus should remain on the MLDP model for now.
These updated estimates show that our 2023 projections were conservative—but even after nearly two years, they remain largely aligned with today’s model-based outlook. The only notable shift is that the steady, relatively calm nature of this current run has slightly raised our top-end price targets.
While the first two points suggest we’re not at the top yet, and that better estimates will come later in the cycle, we can already say this: ultra-bullish calls for $500K or even $1 million BTC—often seen floating around online—are extremely unlikely for this cycle. In our simulations, we used cautious and realistic assumptions for the inputs. Even so, plugging in those extreme price targets would cause the model readings to break sharply from past behavior. If that happens, great—we’ll happily take the profits. But realistically, such a break would mean Bitcoin is no longer following any historical script. And if Bitcoin does deviate from the past, we believe it’s more likely to do so by becoming less euphoric than in its early years—not more.
Conclusion
Our view remains that this is more likely the beginning of a move than the end—though it wouldn’t be surprising to see Bitcoin consolidate or grind sideways over the next few days as the market digests this repricing. A sustained inflow into spot Bitcoin ETFs and a continued rise in new on-chain participants should support this outlook, even if price action cools temporarily. We’ll be closely watching our MLDP Z-score, which should help us gauge where this bullish leg might peak. Based on our simulations, a move into the $132K–$140K range seems plausible—still well below levels we associate with a true cyclical top.
This latest push should finally create some healthy distance from the psychologically challenging $100K milestone, which we’ve hovered around for far too long. Things are moving quickly now, and I’ll keep you updated as we enter what could be a decisive phase.
As I’ve said before, I no longer place much weight on time-based cycle analysis for Bitcoin. It made sense when halving events played a dominant role in supply dynamics and occurred at predictable intervals. But as the halving’s impact diminishes, we need to accept that Bitcoin may start operating on a different timeline—or at the very least, we shouldn’t be surprised if it does.
Seasonality, however, is the one time-based factor I still take seriously—because it’s rooted in real behavioral patterns: institutional rebalancing before year-end, tax-loss harvesting, new capital entering markets in January, and so on. For Bitcoin, summer has historically been quiet. That’s what happened in 2024, 2023, 2022, and 2020. But I don’t see any structural reason why Bitcoin couldn’t rally in July. In fact, we’ve seen it before—in 2019 and again in 2021.
I remember that 2021 surge vividly. I was on vacation in Italy, considerably leveraged, and when Bitcoin took off, things were going so well that I spontaneously upgraded my hotel room in Sorrento to the top suite—carved into the cliffside itself, with a panoramic view of the Vesuvio volcano. That’s the kind of thing I like to do when we hit a big win—make it tangible. Nothing reckless, just a way to turn screen numbers into real memories. I still thank Bitcoin for that one. I could’ve afforded the room anyway—just like most of you probably could—but Bitcoin’s exuberance gave me the exuberance to really live it.
Tomorrow, I’m flying to Spain. It won’t be a vacation this time, but I’m hoping this 2025 rally keeps pushing—and maybe inspires a few more bold moments worth remembering.
And I’m curious to hear from you: when your portfolio goes through a truly exceptional run, how do you mark the moment?


Hi Vincent
Thanks for the update. By pure chance I opened up an old Bitcoin chart today. I had drawn a trend line from the cyclical peaks in December 2017 and April 2021 but the chart is on a linear scale. The price yesterday reacted bang on the trendline and reversed. It is not a great look when you see it but not sure how much weight to place on this seeing it is a linear based chart!
I wonder what your thoughts are on this trend line?
Thanks
Mike
Ok I did, It is waiting in your inbox :)
Hi Vincent
That's a good story about your time in Italy in 2021. I was still too green in that last run, so wasn't positioned well and didn't know when to take profits effectively. However, this time, I hope to do better, and an anecdote to share as well. This year, with all the craziness going around the world as the backdrop, I was struggling to plan a nice vacation for my family - but with the fall travel date drawing closer, I eventually managed to shut out the noise and just book things. The thought I had was heck, as long as I'm responsible and keep things within means, spending money on family/parents, even if it stings financially, with…
Hi Vincent, have a great time in Spain. One of my favorite destinations. A quick question regarding your purchase of ETH ETF. I've looked at the last few cycle tops for BTC and it seems that alt coins continue to run for 1-3 weeks after BTC top. Would you give your ETH ETF a little more time to run or sell when the BTC sell comes in? Thanks!
Thanks Vincent, very useful!
As a subscriber to IO fund too, a pullback into July/Aug would seem to suit a bigger push to the 200k mark and line up with Knox’s major time cycles he puts a lot of emphasis on.
Do you have any thoughts on this?
Enjoy your travels 🙂